


Jan 30, 2026
Most enterprise software doesn’t fail because the features are missing.
It fails because people can’t find what they need fast enough.
A sales rep digging through five dashboards to locate account activity.A finance manager opening multiple reports just to approve one invoice.An operations team exporting data into spreadsheets because the system is too confusing to trust.
These aren’t UX problems in the visual sense. They’re information architecture failures.
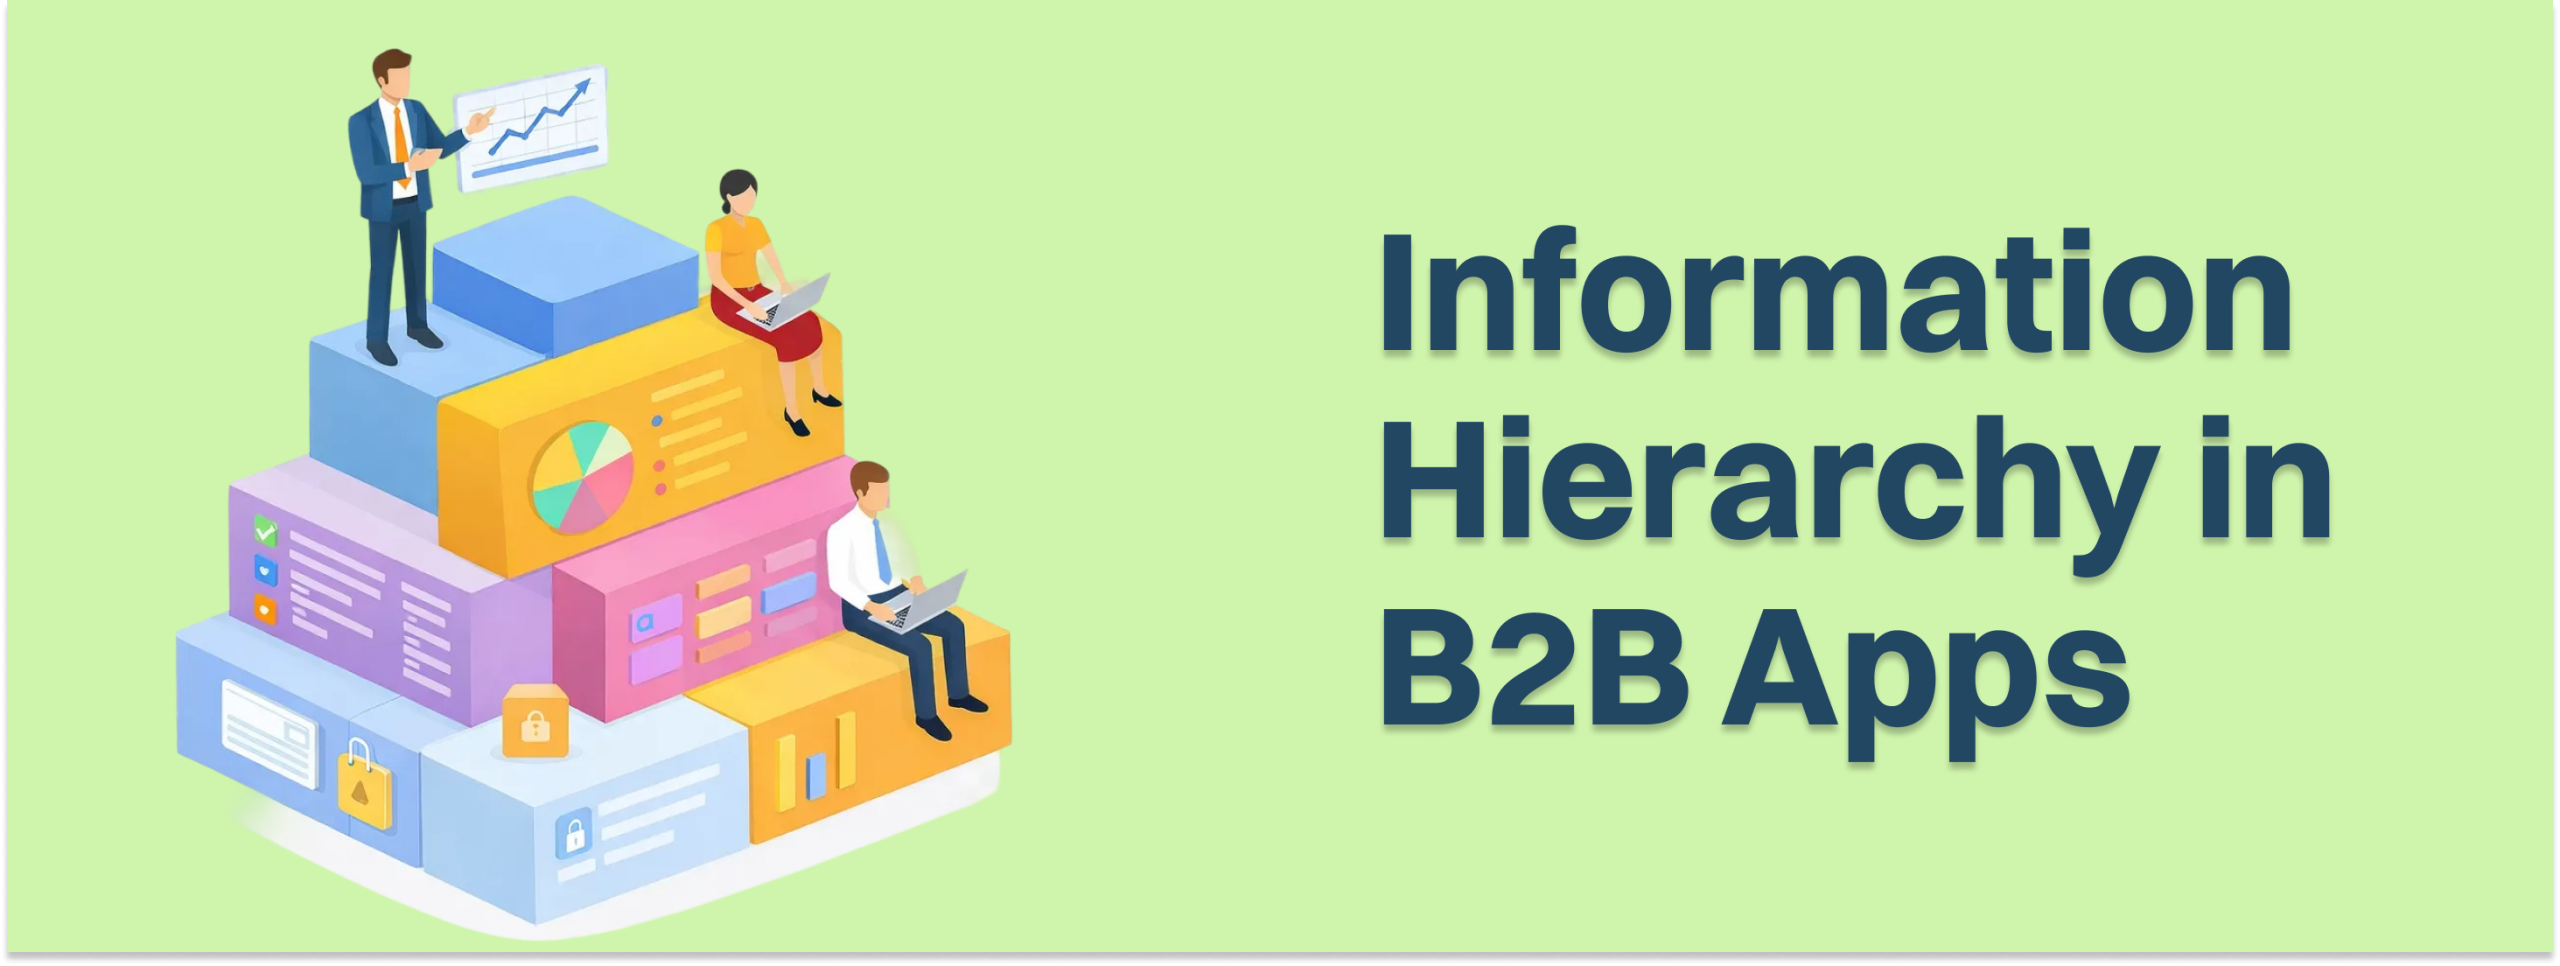
In B2B products, the way information is structured determines whether software accelerates work or quietly becomes a bottleneck. As enterprise data grows exponentially, information hierarchy is no longer a design detail. It is the foundation of productivity.
In enterprise software, information architecture is the structural blueprint of the product.UX covers the broader experience: visual design, usability, accessibility, and emotional response. IA focuses on the organization of information itself.
Think of it this way:
| Aspect | Information Architecture | User Experience |
| Focus | Structure and labeling | Overall product experience |
| Outputs | Sitemaps, taxonomies, structure | Journeys, prototypes, interfaces |
| Goal | Findability and comprehension | Satisfaction and task completion |
In B2B systems, IA determines whether professionals can navigate dashboards, forms, and data models without cognitive friction.
Practically, that means:
A project, for example, isn’t just a page. It is a living object with relationships, attributes, and lifecycle stages. Good architecture treats content this way from the start. Bad architecture treats everything like isolated screens.
Enterprise applications typically rely on three hierarchy models. Each solves a different problem.
The most common model.Information is organized from broad to specific in a tree structure. Example hierarchy in a project platform:
Workspace
→ Account
→ Project
→ Task
Benefits:
This model works best for general navigation and structured data systems.
Sequential hierarchies guide users through a step by step process.
Typical use cases:
Only the information needed for the current step is visible. Everything else stays hidden until required. The advantage is simple. It reduces cognitive overload during complex processes.
Matrix models allow users to navigate data in multiple ways. For example, analysts might filter information by:
This structure is powerful but dangerous if poorly executed. Without strong labeling and hierarchy, users can easily get lost.
Navigation is only the visible layer of information architecture. Behind it sits the enterprise data model that defines how data actually behaves. There are three layers.
High level abstraction. Defines the main business objects:
This layer aligns stakeholders around how the business works.
Adds detail and relationships. Example:
A manager can approve an invoice only if it falls within their budget authority. Logical models define these rules without worrying about database implementation.
The implementation layer.
It defines:
For B2B applications handling massive datasets, physical models determine whether the product feels responsive or painfully slow.
Enterprise tasks are inherently complex. Design cannot remove that complexity, but it can remove unnecessary cognitive effort. Cognitive Load Theory identifies three types.
| Load Type | Source | Design Strategy |
| Intrinsic | Task complexity | Simplify workflows where possible |
| Extraneous | Poor interface design | Remove clutter and reduce choices |
| Germane | Insight generation | Support analysis and learning |
The goal of information architecture is simple:
Eliminate extraneous load so professionals can focus on decisions.
Hick’s Law states that decision time increases with the number of choices. In enterprise dashboards, this often shows up as:
The result is decision fatigue and more errors. Chunking information into meaningful groups solves this problem.
When displaying data, clarity matters more than decoration. Edward Tufte’s data ink ratio suggests maximizing the amount of visual space dedicated to real data rather than unnecessary graphics. However, extreme minimalism can backfire.
Sometimes grid lines, labels, or slightly heavier visual framing actually improve comprehension for professional users.
Design teams often debate this. Should enterprise tools be minimal or dense? The answer depends on the user.
Minimal interfaces work well when users are:
They reduce friction and help people learn the system.
Expert users often prefer high information density. Financial traders, video editors, and network engineers rely on dense interfaces because they need to see everything at once.Hiding data behind progressive disclosure slows them down.The key is organization.
A dense interface that is well structured allows experts to scan and act instantly.
Enterprise applications rarely serve just one user.
Typical roles include:
Designing one generic dashboard for all of them creates confusion.Instead, dashboards should follow a hierarchy that mirrors real decision flows.
Top Row: State Awareness
Answer the question: Are we okay? Limit this to three to five signals such as KPIs or alerts.
Left Column: Task Priorities
Users scan interfaces in an F pattern. Placing task queues or alerts here helps answer: What should I do next?
Center: Diagnosis
Charts and comparative analytics explain why something happened. This is where analysts spend most of their time.
Right Rail: Context
Supplementary information such as notes, metadata, or recent changes belongs here.
Professional design teams rarely jump straight into wireframes. The Double Diamond process separates understanding the problem from building the solution.
Teams gather data through:
This reveals hidden policies, jargon, and workflow constraints.
Insights are synthesized into:
This stage identifies the core nouns of the system.
Multiple IA structures and UI approaches are explored through low fidelity prototypes.
The best option is refined into high fidelity models and validated with usability testing. This structured process prevents teams from designing navigation based on internal assumptions. At Redbaton, this separation between discovery and solution design is often what prevents enterprise products from drifting into feature driven chaos.
Information architecture should never rely on intuition alone. Two research methods are particularly valuable.
Users group information into categories that make sense to them. This reveals natural mental models and labeling patterns.
Tree testing evaluates whether users can locate information within a hierarchy. Unlike usability testing, it focuses purely on navigation logic without visual design distractions.
Teams typically measure:
These metrics quickly expose structural weaknesses.
Enterprise products involve many stakeholders. Everyone has opinions about structure. An IA decision matrix helps teams evaluate options objectively.
Key criteria often include:
| Category | Evaluation Factor | Weight |
| Usability | Findability and cognitive load | 5 |
| Business | Strategic alignment and ROI | 4 |
| Technical | Scalability and performance | 4 |
| Maintenance | Cost and consistency | 3 |
Each architecture option is scored against these criteria. The weighted score identifies the best direction. Architecture Decision Records are then used to document why a structure was chosen so future teams understand the rationale.
The three click rule is one of the most persistent myths in UX.Research shows that abandonment rates do not correlate with the number of clicks.What actually matters is information scent. If users feel confident that each step moves them closer to their goal, they will continue navigating even if the path requires several steps. For enterprise workflows, forcing everything into three clicks can actually increase cognitive load. Instead of structured navigation, teams cram dozens of options into one screen. Clarity matters more than click count.
When information hierarchy improves, the business impact can be dramatic.
BKT modernized its digital banking experience by restructuring transaction grouping and onboarding flows.The result was a shift in brand perception from traditional bank to digital innovator.
Mauritius Telecom expanded its my.t money platform with personalized dashboards supporting more than 100 user scenarios.The app now serves over 300,000 users and has won multiple design awards.
In one CRM redesign:
Another CRM transformation introduced a “single pane of glass” interface where sales reps stayed on one screen during calling sessions. Daily calls increased from 65 to 95 per rep. Training time dropped from two weeks to three days. Information architecture directly affected revenue.
Enterprise platforms rarely fail overnight.
They decay gradually. Common warning signs include:
This is often called accidental complexity. A well known example is the 2012 Knight Capital trading loss where legacy code interactions triggered a $440 million loss within 45 minutes. The problem wasn’t trading logic. It was structural complexity in deployment systems. Architecture integrity matters.
Information architecture also shapes how companies structure their digital presence. B2B websites increasingly rely on semantic SEO.This means organizing content around relationships between topics rather than isolated pages.
The structure usually includes:
Authoritative guides on core topics.
Supporting articles that explore subtopics.
Connections between cluster content and pillar pages help search engines understand topical authority.
For example, discussions around enterprise UX strategy naturally connect to topics like information hierarchy and product design frameworks, strengthening the knowledge network across the Redbaton blog.
Enterprise systems are moving toward autonomous workflows. Instead of passive record systems, future platforms will include AI agents capable of:
Information architecture will evolve alongside this shift. The focus will move from human navigation menus to machine readable structures that AI can interpret. Organizations that modernize their data architecture will move faster than those maintaining legacy systems.
The gap is already widening.
Information hierarchy is the structured organization of data, navigation, and workflows inside enterprise software. It determines how easily professionals can find information and complete tasks.
B2B platforms handle complex workflows and large datasets. Poor architecture increases cognitive load, slows decision making, and often pushes teams toward external tools like spreadsheets.
Hierarchical tree structures are the most widely used. They organize information from broad categories to specific objects, helping users understand location and relationships.
Common validation methods include card sorting to understand user mental models and tree testing to measure how easily users can find information within a hierarchy.
No. Research shows that users care more about clarity and perceived progress than click count. Well structured navigation can require several steps without hurting usability.
If your product roadmap keeps adding features but productivity isn’t improving, the issue may not be capability. It may be structure. Information architecture determines whether teams move faster or fight the system every day. If you’re evaluating a redesign, migrating legacy systems, or building a complex B2B platform, structuring the product around real workflows is the first strategic decision.


